by Dana Anspach, The Balance, March 2022
Do presidential elections influence the stock market? On one hand, the stock market is indeed cyclical, making it possible for investors to look to history to observe trends and make predictions.
On the other, you can’t always count on future returns to match past ones. Despite some consistent patterns, election years are no exception.
Election Years and Market Theories
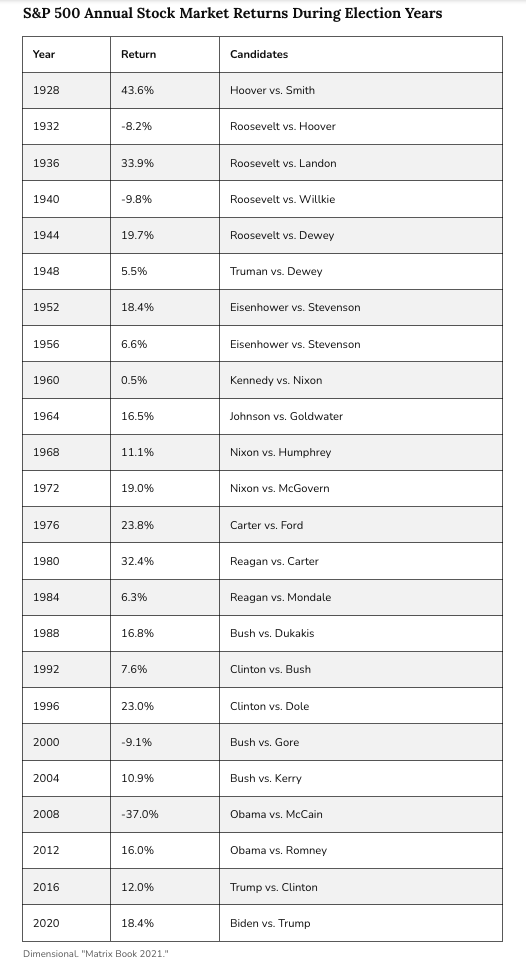
According to the 2021 Dimensional Funds report, the market has been favorable overall in 20 of the 24 election years from 1928 to 2020, only showing negative returns four times.1
When you further examine the years between elections, however, it becomes apparent that year three of a president’s term is usually the strongest year for the market, followed by year four, then the second, and finally the first.
This “Presidential Election Cycle Theory” was initially put forth by Yale Hirsch, the Stock Trader’s Almanac creator. It was furthered by Pepperdine professor Marshall Nickles, in a paper called “Presidential Elections and Stock Market Cycles,” which presented data showing that one profitable strategy would be to invest on October 1 of the second year of a presidential term, and sell on December 31 of year four.2
These studies have pointed out some significant trends, but that doesn’t mean they always hold.
Recent Election Examples
Recent history has particularly challenged these patterns. During the presidencies of Barack Obama and Donald Trump, these stock market theories did not hold up. In each of Obama’s terms, the first two years were more profitable than the third. For Trump, the first year was more profitable than the second, before a major surge in his third year, followed by the volatile markets of 2020.3
Investors trying to time the markets during these presidential terms did not match past market data.
If you were to follow the theory that the fourth year of a term sees better returns than the first, the market in 2008 should have delivered better returns than it did in 2005, when George W. Bush started his second term as president, and the S&P 500 Index gained 4.9%. But 2008, a controversial election year, saw returns drop by 37.0%. If you had followed the theory and invested in the stock market from October 1, 2006, until December 31, 2008, your investments would have been down.4
Note
Recessions aren’t always predictable. In 2008 and 2020, significant economic factors shocked the economy and bucked the election year trends.
Numerous Factors Affect the Market
The problem with investing based on such data patterns is that it’s not a sound way to make investment decisions. It sounds exciting, and it fulfills a belief that many people have that there’s a way to “beat the market.” But there’s no guarantee. There are too many other forces at work that affect market conditions.
Furthermore, the underlying assumptions informing these theories might not hold up, either. They hold that the first year of a term sees a recently elected president working to fulfill campaign promises. The final two years are assumed to be consumed by campaigning and efforts to strengthen the economy. These assumptions may prove true in some cases, but not always.
It might be better to invest in a less exciting but safer way, which involves understanding risk and return, diversifying, and buying low-cost index funds to own for the long term, no matter who wins the election. As noted economist and Nobel Prize winner Paul Samuelson put it, “As noted economist and Nobel Prize winner Paul Samuelson put it, “Investing should be more like watching paint dry or watching grass grow. If you want excitement, take $800 and go to Las Vegas.”5
Election Year Stock Market Returns
Here are the market results for the S&P 500 for every election year since 1928.6
Frequently Asked Questions (FAQs)
Which president had the best stock market performance?
Overall, President Bill Clinton had the best stock market performance based on the S&P 500 and the best based on the Dow Jones Industrial Average (DJIA) since Calvin Coolidge. The DJIA increased 15.94% under President Clinton, and the S&P 500 increased 15.18%. President Barack Obama had the second-best performance. The DJIA increased 12.10%, and the S&P 500 increased 13.84% during his terms.7
How did the stock market perform under President Trump?
President Trump trailed President Clinton and President Obama when it comes to the S&P 500 and DJIA. The DJIA increased 11.77% during his term, while the S&P 500 increased 13.73%. President Trump saw the highest increase on the Nasdaq, however, with an increase of 24.17% during his term.7
- Dimensional. “Matrix Book 2021,” Pages 14-17.
- Graziadio Business Review. “Presidential Elections and Stock Market Cycles.”
- Dimensional. “Matrix Book 2021,” Pages 14-17.
- Dimensional. “Matrix Book 2021,” Page 17.
- Paul B. Farrell. “The Lazy Person’s Guide to Investing.” Grand Central Publishing, 2004.
- Dimensional. “Matrix Book 2021,” Pages 16-17.
- MarketWatch. “Stock-Market Performance Under Trump Trails Only Obama and Clinton.”
This material is intended for informational/educational purposes only and should not be construed as tax, legal or investment advice, a solicitation, or a recommendation to buy or sell any security or investment product. Investments are subject to risk, including the loss of principal. Some investments are not suitable for all investors, and there is no guarantee that any investing goal will be met. Certain sections of this material may contain forward-looking statements. Forward-looking statements are not guarantees of future performance and involve certain risks and uncertainties, which are difficult to predict. Past performance is no guarantee of future results. Third-party links are provided to you as a courtesy. We make no representation as to the completeness or accuracy of information provided at these websites. Information on such sites, including third-party links contained within, should not be construed as an endorsement or adoption of any kind. Please consult with your financial professional and/or a legal or tax professional regarding your specific situation and before making any investing decisions.